
Karl has been involved in the business to business information service since 1990. Having spent time with information to the construction and manufacturing industry in the UK, Sweden, Switzerland, Germany and the US.

The Contract Manufacturing Index (CMI) has been developed to reflect the total purchasing budget of companies that are looking to outsource manufacturing in any given month.
This reflects a sample of over 4,000 companies, who have a purchasing budget of more than £3bn and a supplier base sample of over 7,000 vendors, with a verified turnover in excess of £25bn.
We measure this by extracting data from the projects we receive from manufacturing purchasers, who have an active need for the services of subcontract engineering suppliers.
Since 2016, we have published the index quarterly and the following is a summary of our findings for the whole of 2016. In order to shed more light on the emerging trends, we have also broken this down by process, region and industry.
Key points
- The Index is split by three processes, Machining, Fabrication and Others.
- The Country is split into 10 regions
- The data for 2016 is collected from over 1,600 companies and 2,150 projects
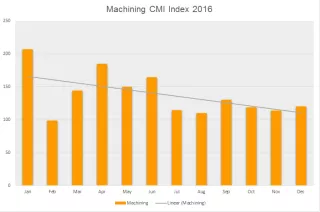
Machining
2016 started well for machining and during the first quarter, was up on the previous year. However, the following three quarters saw a drop-off in the size of companies that were outsourcing machining and the index fell from 202 in January, down to 128 in December.
Key Points
- We get 52% of our projects from Machining
- The buyers who gave us these projects during 2016, have a total outsourcing value of £129,978,520.
- The index as average over 2016 is up 28% on 2015 average.
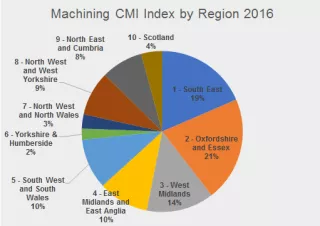
Machining by Region
After studying the geographical split of machining projects, we can see that the southern regions are dominating here.
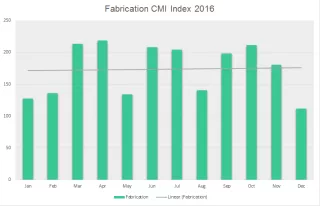
Fabrication
The 2016 trend for fabrication has had a slow-rising trajectory, but with large variations from month to month. The fabrication umbrella incorporates sub-processes such as cutting, bending, enclosures, etc. We receive a large amount of projects within this field – in fact it is second only to machining.
Key points
- 42% of our projects are for fabrication processes.
- The buyers who gave us these projects during 2016, have a total outsourcing value of £122,224,031.
- The index is up 32% on 2015 average.
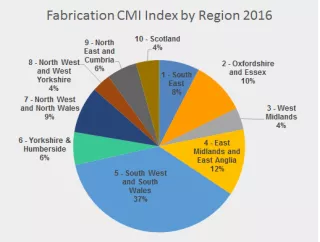
Fabrication by Region
South West and South Wales (Region 5) dominates this arena, representing 37% of the total outsourcing values for fabrication. Together with East Midlands and East Anglia (Region 4), they represent 49% of the entire country.
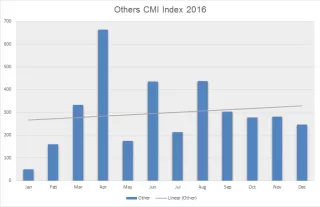
Others
Representing processes such as casting, toolmaking, finishing, plastics & rubber, the ‘Others’ category only makes up 6% of our projects and is therefore more difficult to monitor. 2016 appears to have been a good year for the placement of work under the ‘Others’ umbrella, with the January index standing at 50 and finishing at 247 in December. As you can see, it fluctuated drastically throughout the year; however, a good end result was still achieved. The total purchasing value of the companies outsourcing these processes is £167,854,884 for 2016.
Key Points
- 6% of our projects fall under the ‘Others’ category.
- The buyers who gave us these projects during 2016, have a total outsourcing value of £21,745,031.
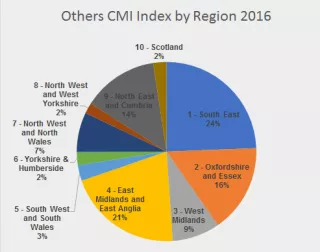
Others by Region
These projects tend to be a bit more evenly spread over the country, but a few regions do take precedent. As this sample comprises a smaller number of projects than machining and fabrication, it is harder to draw conclusions. However, we have included it to give a comprehensive view of the industry as a whole.
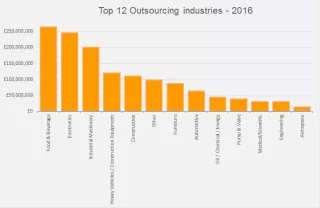
Industry
The industry in which the manufactured parts are destined for use is recorded, as opposed to the industry of the company outsourcing the work. We have only shown the top 12 industries, as some of the others are reflected by very small percentages..
Top three Industries
- Food and Beverage is our largest industry for 2016 and is also our biggest riser, having come from 14th place in 2015.
- Electronics was 4th last year and mainly outsources projects for enclosures.
- Industrial Machinery was nudged down from 2nd to 3rd place this year.
Conclusion
With a tumultuous political climate prevailing throughout most of 2016, it is no surprise that the UK manufacturing industry experienced intense fluctuations. Perhaps as a knee-jerk reaction to mounting uncertainty, many buyers maintained a tighter grasp over their budgets in the wake of the EU referendum. Machining felt the knock-on effects of a Brexit-bound Britain more than other areas of the industry, although it certainly cannot be said that this was an exclusive detriment.
On a more positive note, we see the Index levelling out significantly towards the end of the year, suggesting that confidence is gradually being restored within the UK market as a whole. The emergence of new industries as key players within the buying sphere shows a redistribution of purchasing authority; 2017’s results will confirm whether or not this is a permanent shift, or if previous trends begin to resurface as the referendum’s aftershocks lessen.
Of course, as the UK prepares to trigger Article 50, it is not only possible but perhaps certain that we will see further changes to the Index over the following twelve months. At this stage, it’s almost too early to predict what these changes will be – regardless, 2016’s findings illustrate the importance of a united industry to navigate whatever turbulence lies ahead.