
Karl has been involved in the business to business information service since 1990. Having spent time with information to the construction and manufacturing industry in the UK, Sweden, Switzerland, Germany and the US.

The Contract Manufacturing Index (CMI) has been developed to reflect the total purchasing budget of companies that are looking to outsource manufacturing in any given month.
This reflects a sample of over 4,000 companies, who have a purchasing budget of more than £3bn and a supplier base sample of over 7,000 vendors, with a verified turnover in excess of £25bn.
We measure this by extracting data from the projects we receive from manufacturing purchasers, who have an active need for the services of subcontract engineering suppliers.
Since 2016, we have published the index quarterly and the following is a summary of our findings for the third quarter of 2017. In order to shed more light on the emerging trends, we have also broken this down by process and industry.
Key points
- The Index is split by three processes - Machining, Fabrication, and Others.
- 2017’s data for quarter 3 is collected from 348 companies and 616 projects.
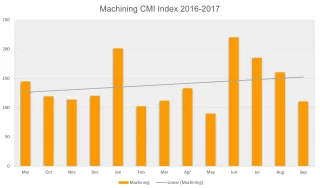
Machining
Following the second quarter, machining enjoyed a 3% increase in quarter 3 and a 29% increase comparatively to the same quarter in 2016. This is an especially encouraging result, confirming that the machining index has recuperated from the substantial downturn it took in 2016, as previously reported in our annual summary.
Key Points
- 51% of the third quarter’s projects were for machining processes.
- The buyers who gave us these projects have a total outsourcing value of £23,564,000, which is above the average for 2017 and 2016.
- The machining index grew by 3% compared to last quarter, which is up 4% on the average over the whole of 2017 thus far.
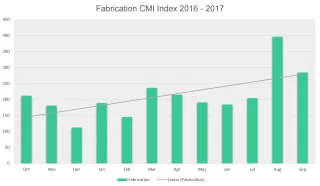
Fabrication
With quarter 2 undergoing a 3.1% rise in relation to the first quarter, the latest results for quarter 3 reflect an astronomical increase of 50% further still. These figures are excellent news for the buoyancy of the industry, as the fabrication market didn’t suffer the same plight as machining during 2016; although somewhat erratic from month to month, the index experienced a steady rise over the course of last year.
The latest quarter’s growth is largely due to the prominence of the electronics industry amongst the buyers outsourcing projects of this nature. The electronics sector has massively increased its subcontract fabrication usage, therefore aiding the expansion of the corresponding index.
Key Points
- 40% of the third quarter’s projects were for fabrication processes.
- The buyers who gave us these projects have a total outsourcing value of £30,950,475.
- The fabrication index grew by 50% compared to last quarter, which is up 30% on the average over the whole of 2017 thus far.
- The sudden growth is largely thanks to the electronics industry, which has substantially increased its usage of subcontract fabrication services.
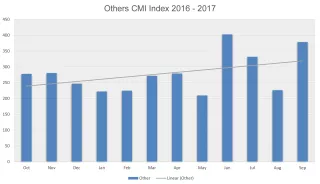
Others
Representing processes such as casting, toolmaking, finishing, plastics & rubber, the ‘Others’ category only makes up 9% of the projects from the third quarter and is therefore more difficult to monitor. However, the results show that the index for this category has increased by 5% on the last quarter, although this is still 2% less than the comparative quarter for 2016.
Key Points
- Only 9% of the third quarter’s projects were for processes that fall under the ‘Others’ category.
- The buyers who gave us these projects have a total outsourcing value of £4,685,000, which is up 10% on the average over the whole of 2017 thus far.
- The index for these processes grew by 5% compared to last quarter.
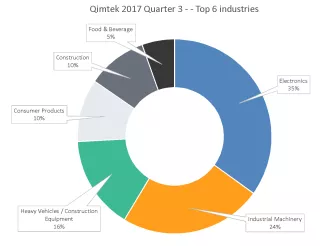
Industry
- Electronics features in first place, outsourcing over 35% of quarter 3’s projects. This has risen from third place in quarter 2.
- Industrial Machinery is the second largest contender, representing 24% of projects from 2017’s third quarter.
- Heavy Vehicles / Construction Equipment comes in third place for quarter 3, having previously occupied second place in quarter 2. 16% of projects are represented by this sector.
The top three industries underwent a reshuffling during the third quarter, with electronics moving to the forefront of the results having previously occupied second place. Industrial machinery had to make way for the new leader and subsequently, it fell to second position; this resulted in heavy vehicles/construction equipment also succumbing to the resulting domino effect and falling into third. It’s important to note that despite its decline in the results, industrial machinery actually grew from 21% in quarter 2 to 24% in quarter 3; however, this was no match for electronics which increased by a massive 17% from July to September.
Consumer products also underwent substantial growth, having risen from twelfth place into fourth. The construction sector experienced a slight rise of 2% from quarter 2 into quarter 3, moving it into fifth position. The third quarter’s results also saw the re-emergence of food & beverage into the top industries, with a significant rise into sixth place from eleventh in the preceding quarter.
Conclusion
Defying the usual trend for the third quarter - which tends to be something of a slowdown period on account of summer holidays - the last three months have been extremely active, with a particular focus on August as the busiest month of the year thus far. Indeed, the CM Index has followed the same trajectory as the CIPS PMI Index, which also reported an influx during August, followed by a slightly slower September.
This is largely due to the substantial growth of the subcontract fabrication market, which rose by a massive 50% from quarter 2. Reviewing this area of the index independently, we can see that the main driver behind the reported expansion was the electronics industry, which vastly increased their usage of outsourced fabrication services over the last quarter.
Although nowhere near as drastic, machining also experienced a rise of 3%, which equates to an impressive 29% compared to the same quarter in 2016. Over the course of last year, the machining index fell dramatically and the latest findings reaffirm the continuing recovery of its respective subcontract market. Despite slowing down during the months of August and September, we are hopeful that machining will get back up to speed in the final quarter of 2017.