
Karl has been involved in the business to business information service since 1990. Having spent time with information to the construction and manufacturing industry in the UK, Sweden, Switzerland, Germany and the US.

- The Index is split into three processes - Machining, Fabrication, and Others.
- 2021’s data for Quarter 4 is collected from 242 companies and 352 projects.
- Quarter 4's Index fell by 6% against the preceding quarter; however, this could be largely attributed to a seasonal downturn.
- The Fabrication and Others Indexes both reported growth against quarter 3; however, the Machining Index showed a decline.
- The worldwide materials shortage continues to affect the industry, as the average number of quotes received per project falls to 2.6.
Quarter 4 2021's Contract Manufacturing Index has revealed a 6% decline in subcontract activity compared to the preceding quarter. Although October was a relatively strong month across the board, all three indexes saw an incremental decline from month to month for the remainder of the year. This trend proved to be especially pronounced within the Machining Index and Others Index, whilst the Fabrication Index returned much more consistent levels of activity.
The Machining Index was the only index to report a loss, whilst the Fabrication and Others Indexes grew over the fourth quarter.
Despite this, the Machining Index was the only index to report a loss, whilst the Fabrication and Others Indexes grew over the fourth quarter overall. At a time where a seasonal downturn in activity is traditional, this is perhaps surprising but nonetheless extremely encouraging. With a number of issues at play within the UK's subcontract engineering market at present, the fact that only one index lost ground points to the sector's resilience at an unprecedented time.
However, the effects of the worldwide materials shortage are evident elsewhere in the data - especially when it comes to the average number of quotes received per project. This number fell to just 2.6 within quarter 4, which illustrates suppliers' reluctance to quote for projects given the uncertainty surrounding the availability of materials. The materials shortage is certainly an ongoing issue predating the fourth quarter, but this steadily-declining average shows us that its effects continue to blight activity levels.
The effects of the worldwide materials shortage are evident elsewhere in the data.
It cannot be overlooked that quarter 4 has historically been a slower period for the industry overall, so despite the industry's current hardships, we are optimistic that the first quarter of 2022 will report growth against the current Index. However, as long as the materials shortage continues, the reluctance of suppliers to commit to new projects will ultimately remain.
Machining:
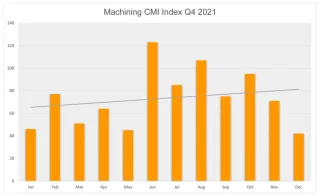
The Machining Index had a positive second and third quarter; however, levels of outsourced machining fell from October to December 2021, with a steady decline from month to month throughout this period. This meant that quarter 4's Machining Index finished 7% down on the results for the third quarter, with a significant drop of 22% in comparison to the fourth quarter of 2020.
Levels of outsourced machining fell from October to December 2021, with a steady decline from month to month.
Although the Machining Index has traditionally seen a seasonal downturn in the final quarter of the year, the comparison to 2020's results indicates that there are more factors at play. The worldwide materials shortage continues to be evident in the data, along with the lingering effects of the COVID-19 pandemic and Brexit which could all have had a hand in the slowdown of activity.
- 29% of the fourth quarter's projects were for machining processes.
- The buyers who gave us these projects have a total outsourcing value of £13,923,350, compared to a value of £17,866,572 in quarter 3 2021.
- The Machining Index finished the fourth quarter 7% down on quarter 3, with a value 22% less than that of the fourth quarter of 2020.
Fabrication:
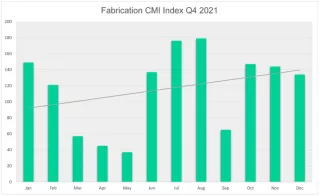
Fabrication processes continued to dominate the Contract Manufacturing Index during the final quarter of 2021, accounting for 57% of all projects outsourced during this period. After a somewhat erratic performance throughout the year, the Fabrication Index maintained a consistent level of activity from October to December, with only a slight decrease from month to month at a time where the industry traditionally undergoes a seasonal lull. The latest results reflect a slight increase of 1.5% in comparison to the third quarter of 2021, although a year-on-year comparison reveals a much more dramatic upturn.
The Fabrication Index maintained a consistent level of activity, with only a slight decrease from month to month.
In fact, the Fabrication Index closed 2021 with growth of 202% against the comparable quarter for 2020, showing that this industry has managed a significant recovery following the COVID-19 pandemic and the ensuing national lockdowns. With a consistent performance now across two consecutive quarters, this may mean that the fabrication sector is stabilising as we move into 2022.
- 57% of the fourth quarter’s projects were for fabrication processes.
- The buyers who gave us these projects have a total outsourcing value of £26,753,487, compared to £26,420,655 during Quarter 3 2021.
- Quarter 4's Fabrication Index reported a slight growth of 1.5% in comparison to the preceding quarter; however, it was up by a whopping 202% on the comparable quarter of 2020.
Others:
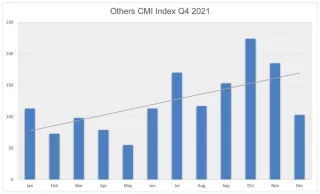
The Others Index has seen a continuation of the surge it experienced during the third quarter.
Representing processes such as casting, toolmaking, finishing, plastics & rubber, the ‘Others’ category makes up 14% of the projects generated within the fourth quarter and is therefore more difficult to monitor. However, the Others Index has seen a continuation of the surge it experienced during the third quarter, during which time it grew by 99%, with the data for quarter 4 showing a rise of 33% further still. Although this Index declined in pronounced increments from October to December, it still finished the year 16% larger than in the final quarter of 2020.
- 14% of the third quarter’s projects were for processes that fall under the ‘Others’ category.
- The buyers who gave us these projects have a total outsourcing value of £6,625,627, compared to a value of £5,701,900 in quarter 3, 2021.
- Having undergone a pronounced uptick in activity during the third quarter, this trend has continued into the final quarter of the year with a rise of 33% further still. This figure is also 16% above the result for the fourth quarter of 2020.
Industries:
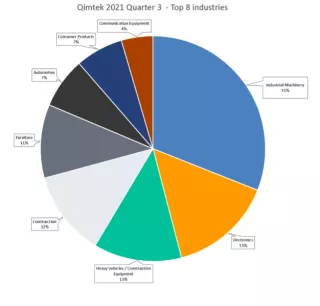
- Two of the top 3 industries remained unmoved from quarter 3 into quarter 4. The first was the Industrial Machinery sector - the top purchaser in both quarters, accounting for 31% of the latest results.
- The Electronics industry saw an increase in purchasing activity, propelling it into second place in quarter 4 having placed sixth during the third quarter of 2021. However, there was a pronounced contrast in the splits represented by first and second place, with Electronics only accounting for 15% of quarter 4's purchasing activity.
- Heavy Vehicles/Construction Equipment was another non-mover, retaining its position in third place across both quarter 3 and quarter 4.
- Newcomers to quarter 4's Index include Furniture, Automotive and Communication Equipment. Meanwhile, Food & Beverage, Pump & Valve and Oil/Chemical/Energy disappeared from the running, having previously placed within the top industries in quarter 3.
Although Quarter 4's Index illustrated a lot of changes within the top industries represented, much of this activity was consigned to the lower portion of the results. Within the top three positions, there was plenty of consistency between quarter 3 and quarter 4's Indexes, with the Industrial Machinery and Heavy Vehicles/Construction Equipment sectors occupying first and third place respectively for the entirety of the second half of the year. However, there was a strong contrast between the shares accounted for by Industrial Machinery in first place (31%) and the Electronics industry in second place (15%), with the latter having ascended from sixth place in quarter 3.
Within the top three positions, there was plenty of consistency between quarter 3 and quarter 4.
Meanwhile, the Construction industry showed a slight lull in activity, dropping from second into fourth position from October to December. This sector accounted for 12% of the overall results, putting it just behind that of Heavy Vehicles/Construction Equipment with 13%. Despite the chasm between the splits of first and second position, the rest of the results show a much more even distribution between the industries represented, hinting at a consistent level of activity across the board.
In fifth place, the Furniture industry reemerged (11%), having dropped out of the third quarter's results altogether. This was followed by another newcomer - the Automotive sector - which has been absent from the Index since the first quarter of 2020.
Much of the shakeup was consigned to the lower portion of the results.
In seventh position, the Consumer Products industry accounted for 7% of purchasing activity from October to December; however, this was less than in quarter 3, during which time it finished in fourth place with a 13% share. At the bottom of the table, in eighth place, the Communications Equipment sector held 4% of the fourth quarter's Index, making its first appearance since the first quarter of the year.
Meanwhile, a number of sectors disappeared from the Index's top industries in Quarter 4 including Food & Beverage, Pump & Valve and Oil/Chemical/Energy.
About the Contract Manufacturing Index
The Contract Manufacturing Index (CMI) has been developed to reflect the total purchasing budget of companies that are looking to outsource manufacturing in any given month.
This reflects a sample of over 4,000 companies, who have a purchasing budget of more than £3bn and a supplier base sample of over 7,000 vendors, with a verified turnover in excess of £25bn.
We measure this by extracting data from the projects we receive from manufacturing purchasers who have an active need for the services of subcontract engineering suppliers.
Since 2016, we have published the index quarterly and this report is a summary of our findings for the fourth quarter of 2021. In order to shed more light on the emerging trends, we have also broken this down by process and industry.