
Karl has been involved in the business to business information service since 1990. Having spent time with information to the construction and manufacturing industry in the UK, Sweden, Switzerland, Germany and the US.

Every quarter, Qimtek publishes the Contract Manufacturing Index (CMI) to highlight trends and give insight into the buoyancy of the subcontract manufacturing market.
We do this by monitoring the purchasing budget of companies who are looking to outsource manufacturing within any given month; this reflects a sample of over 4,000 companies with a combined purchasing spend of over £3.4billion, with a verified turnover in excess of £25billion. The information is extracted from the projects we receive from manufacturing purchasers who have an active need for the services of subcontract engineering suppliers - it is therefore exclusive to Qimtek, but reflects the health of the overall market.
The following is an overview of 2018’s data as a whole, showing how the individual indexes performed over the course of the year and which industries outsourced the most.
Key points:
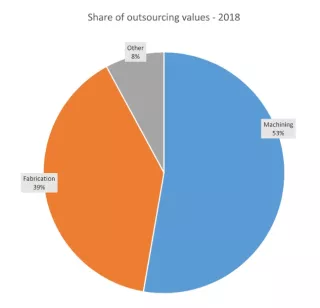
- The Index is split into three processes - Machining, Fabrication, and Others.
- 2018’s data for is collected from 684 companies and 1,953 subcontract engineering projects.
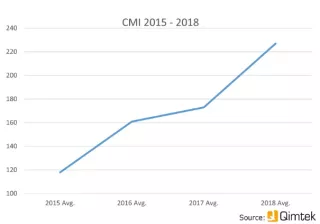
- The Index is up 61% compared to 2017
- The Machining Index is up 47% on 2017’s data.
- The Fabrication Index has grown by 68% this year.
- The ‘Others’ Index - accounting for niche processes such as toolmaking, casting, moulding and finishing - is up by an astonishing 94% on 2017’s index.
Commentary:
After suffering a major downturn during the final quarter of 2017, the industry started to regain traction during the first three months of the year. As March drew to a close, all three indexes - machining, fabrication and ‘others’ - reported substantial growth, with machining expanding by 31%, fabrication by 54% and ‘others’ by 25%. Although growth of the ‘others’ index was less pronounced than its counterparts, this is relative to the size of the index itself, as it has traditionally accounted for a much smaller share of the market.
It could also be confirmed during Quarter 1 that the index had reached its highest level to date, despite indications from other indexes (such as the Markit CIPS Purchasing Index and ONS) that the industry was entering a slower period. Nonetheless, these predictions set the stage for two out of the three indexes during Quarter 2, with both machining and ‘others’ falling short of their expansion during Quarter 1.
This was not the case for the fabrication index, however, as it underwent a further 44% growth during the second quarter of 2018. Indeed, this growth was an exaggerated representation of the precedent set by the fabrication market since the first quarter of 2016, with a steady, consistent incline evident within the data.
Quarter 3 brought with it a shake-up to the performance of the indexes. Fabrication - following a successful first half of the year - began to dwindle, reporting a 24% decrease against the previous quarter’s results. Machining and ‘others’, however, both saw growth over the quarter as a whole, though this was largely due to a strong July, with weaker outputs for August and, in the case of machining, September too.
This trajectory directly contradicts that of the fabrication index for the third quarter, which went into a nosedive during July, before showing small - but consistent - levels of recovery over August and September.
Quarter 4 proved turbulent for both machining and fabrication, with these indexes reporting a 6% and 4% decrease respectively. Despite both areas enjoying a strong performance during October and November, a sudden tail-off in December was enough to bring down their average for the entire three months.
Despite the slowdown of its counterparts, the ‘others’ index experienced its strongest quarter of the year from October to December and ended with a surprising 34% rise against the preceding quarter.
It’s worth noting that the total outsourcing value across all manufacturing buyers grew to £3.4billion over the course of 2018, meaning that the total trackable value has increased by 10% - an extremely positive nod to the overall size of the market, despite the erratic behaviour of the individual indexes from quarter to quarter.
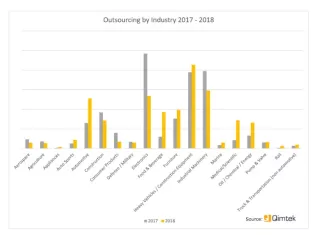
Trend Overview:

The bar graph above show the values of each index month to month, as well as highlighting the overall trend of the data. Please note that machining is shown in orange, fabrication in green and 'others' in blue. Although the value of all three indexes has increased in comparison to 2017’s data, the findings show fluctuations in the trends displayed from index to index. For instance, the machining trend has remained level, meaning that the growth exhibited during busier months such as July and October has been countered by those wherein the value of this index dropped.
The trend for the fabrication index followed a downwards trajectory over the course of 2018, which could result from massive drops in value during April, July and - most notably - December. Meanwhile, the ‘others’ index went from strength to strength; whilst this could result from a rise in outsourcing, it could also be attributed to a drive from the Qimtek sourcing team to generate these kinds of projects for our specialist members.
Distribution of Projects:
The table below shows the distribution of projects across all three indexes in 2017 and 2018 respectively:
20172018
Machining55%53%
Fabrication37%39%
Others7%8%
As you can see, machining lost some ground to both fabrication and ‘others’ during 2018, ending the year with a 2% decrease in project distribution. Fabrication, in turn, grew by 2%, whilst the ‘others’ index also underwent a 1% expansion in comparison to 2017. Regardless of the aforementioned shifts, machining remains the largest subsection of contract manufacturing over both years, accounting for more than half of the total projects generated.
Top Industries:
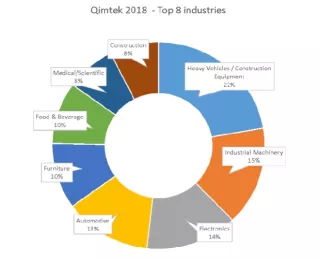
2018 saw a lot of changes to the top industries outsourcing manufacturing, with a number of sectors scaling their spend up and down at certain points of the year. The above chart shows the average distribution of outsourced manufacturing spend per industry for the whole of 2018; however, there were certainly plenty of fluctuations from month to month.
Heavy vehicles/construction equipment came out on top as the largest-spending industry in 2018, accounting for 22% of the overall market. However, this sector has experienced a tumultuous year - having accounted for a gargantuan 43% of the market in Quarter 2, this growth was then tempered during the third quarter, which saw it freefall to just 9%. Nonetheless, Quarter 4’s results report recuperation for the sector and as a result, it rose into third place with a 17% share. Overall, this sector was somewhat static in comparison to 2017’s performance, exhibiting no remarkable changes in outsourcing values.
Industrial machinery - traditionally an industry with a large outsourcing spend - accounted for 15% of 2018’s subcontract engineering market, with a decreased outsourcing value against that of 2017. This sector stayed more or less consistent throughout the year, ranking third in Quarters 1 and 2, before placing fifth in Quarter 3 and performing second-best during the final three months of the year.
The same can be said for the electronics sector - although there were no major fluctuations in terms of its output, electronics increased its outsourcing contribution steadily throughout 2018, before finishing in the year in first place for the final quarter. It’s important to note, however, that despite the consistent growth displayed, this sector never caught up with its overall values for 2017.
There were also a number of other industries which repeatedly featured in the top eight for outsourced manufacturing value, including medical/scientific, food & beverage, automotive and furniture, whilst others such as defence/military and consumer products only made cameo appearances, before disappearing from the running altogether.
Conclusion:
2018 was a positive year for the subcontract manufacturing industry, albeit with some fluctuations surrounding the trends of the individual indexes. The first quarter heralded expansion for all areas of the index; however, the subsequent quarters were inconsistent in terms of success. Despite growth across each index, the ‘others’ index has reported a positive trend, the machining index stayed level and the fabrication index followed a negative trajectory. Nonetheless, the average for the index overall has increased by 61% from 2017, showing pronounced expansion within the levels of outsourcing demonstrated by manufacturing purchasers.
There was also movement within the top industries outsourcing manufacturing, with industrial machinery losing ground against its outsourcing levels for the previous year. Heavy vehicles/construction equipment, having accounted for 43% of all outsourcing manufacturing during quarter 2, went on to decrease its contribution in the following quarter; meaning that its average for 2018 stayed somewhat static. Furthermore, the electronics industry failed to meet the same levels of outsourcing it demonstrated in 2017, despite consistent growth from quarter to quarter in 2018.
As we enter 2019 - a year of political turbulence that will have unforetold effects on the manufacturing industry as a whole - we are confident that the index will experience a surge which counters the seasonal tail-off that punctuated the end of 2018. However, the rest of the year remains something of an enigma as we wait to see whether Brexit helps or hinders national outsourcing efforts.