

Karl has been involved in the business to business information service since 1990. Having spent time with information to the construction and manufacturing industry in the UK, Sweden, Switzerland, Germany and the US.

- The Index is split into three processes - Machining, Fabrication, and Others.
- 2024’s data is collected from 180 companies and 1,299 projects.
- The 2024 CMI index dropped 23% from the 2023 average numbers.
Uncertainty is never good for business but it’s particularly noticeable in the manufacturing of custom made parts industry and 2024 was full of uncertainty.
The two main drivers were the general election in May and the budget in November. A new president in the US has not helped either.
The year started very promising but as we got closer to the May election new business slowed down. The waiting for the budget was very noticeable and September was particularly slow, both by buyers and suppliers. The rest of the year did not pick up.
On the bright side though, the first few weeks in 2025 have been very busy and we hope it will continue and we have a more stable economic outlook.
Machining
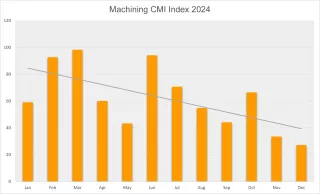
- 54% of 2024 projects were from machining processes.
- The index is for machining is down 9% from the previous year
Fabrication
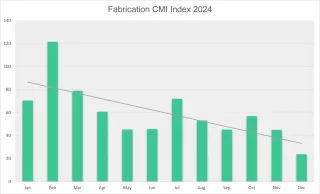
- 36% of 2024 projects were from fabrication processes.
- The index is for fabrication is down 31% from the previous year
Other
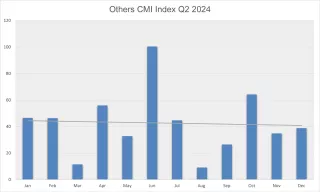
- 10% of 2024 projects were from other processes.
- The index is for other is down 42% from the previous year
Lead times
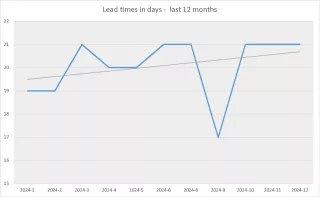
Lead times were steady across the year except for a September when it dropped down to 17 days. We did also see very little activity from Supplier at the same time with far less quotes per projects.
Industry
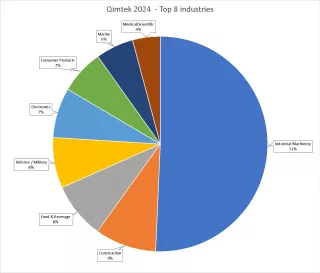
Industrial Machinery is on the top again with Construction and Electronics being in 2nd and 3rd place. During the year Marine and Food & Bevarge has had good quarters but overall they have dropped back.
The main reason Industrial Machinery is almost always the top industry is because it covers so many manufacturing industries which are difficult to breakdown.
About Contract Manufacturing Index
The Contract Manufacturing Index (CMI) has been developed to reflect the total purchasing budget of companies that are looking to outsource subcontract manufacturing of custom made parts in any given month.
This reflects a sample of over 4,000 companies, who have a purchasing budget of more than £5bn and a supplier base sample of over 7,000 vendors, with a verified turnover in excess of £25bn.
We measure this by extracting data from the projects we receive from manufacturing purchasers who have an active need for the services of subcontract engineering suppliers.
Since 2016, we have published the index quarterly and this report is a summary of our findings for the this current quarter. In order to shed more light on the emerging trends, we have also broken this down by process and industry.