
Karl has been involved in the business to business information service since 1990. Having spent time with information to the construction and manufacturing industry in the UK, Sweden, Switzerland, Germany and the US.

The Contract Manufacturing Index (CMI) has been developed to reflect the total purchasing budget of companies that are looking to outsource manufacturing in any given month.
This reflects a sample of over 4,000 companies, who have a purchasing budget of more than £3bn and a supplier base sample of over 7,000 vendors, with a verified turnover in excess of £25bn.
We measure this by extracting data from the projects we receive from manufacturing purchasers, who have an active need for the services of subcontract engineering suppliers.
Since 2016, we have published the index quarterly and the following is a summary of our findings for the first quarter of 2017. In order to shed more light on the emerging trends, we have also broken this down by process and industry.
Key points
- The Index is split by three processes - Machining, Fabrication and Others.
- 2017’s data for quarter 1 is collected from 334 companies and 553 projects.
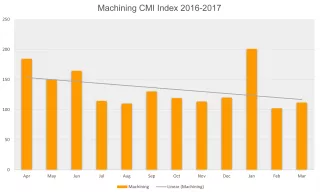
Machining
Compared to the previous quarter, machining enjoyed a 26% increase in quarter 1; however, it is important to note that it is still 4% down on the 2016 average. Nonetheless, you may recall from our annual summary that the size of companies outsourcing machining - and thus, its index - fell dramatically over the course of last year. Therefore, the latest figures bode well for a more positive 2017.
Key Points
- 53% of the first quarter’s projects were for machining processes.
- The buyers who gave us these projects have a total outsourcing value of £21,455,680, which is almost the exact same value as the average for the whole of 2016.
- The machining index grew by 26% compared to last quarter; however, it is still 4% down on the 2016 average.
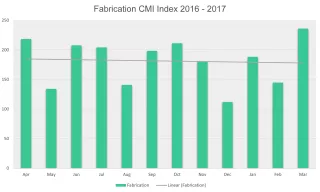
Fabrication
The first quarter’s fabrication index is especially interesting, as it shows a 12% growth on the last quarter, as well as an impressive 8% rise in comparison to 2016’s average. Whereas machining experienced massive fluctuations last year, the fabrication index’s trajectory underwent a slow rise, albeit with large variations from month to month. Further increases within early 2017 are encouraging and will hopefully set the precedent for the coming year
Key Points
- 40% of the first quarter’s projects were for fabrication processes.
- The buyers who gave us these projects have a total outsourcing value of £19,926,730, which is an 8% increase on the average for the whole of 2016.
- The fabrication index grew by 12% compared to last quarter, with a 8% rise on the 2016 average.
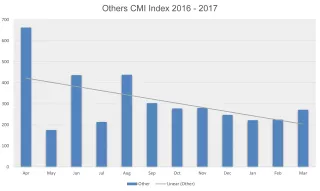
Others
Representing processes such as casting, toolmaking, finishing, plastics & rubber, the ‘Others’ category only makes up 7% of the projects from the first quarter and is therefore more difficult to monitor. However, the results show that the index for this category has decreased by 12% on the last quarter and by a massive 28% in comparison to the 2016 average.
Key Points
- Only 7% of the first quarter’s projects were for processes that fall under the ‘Others’ category.
- The buyers who gave us these projects have a total outsourcing value of £4,079,680, which is a 28% decrease on the average for the whole of 2016.
- The index for these processes shrunk by 12% compared to last quarter, with a 28% decline on the 2016 average.
Industry
Heavy Vehicles / Construction Equipment features in first place, outsourcing over 32% of quarter 1’s projects. This has risen from fourth place in 2016. Electronics is the second largest contender, representing 21% of projects from 2017’s first quarter.
Industrial Machinery has stayed in third place for quarter 1, having previously occupied this position in 2016. 21% of projects are represented by this sector.
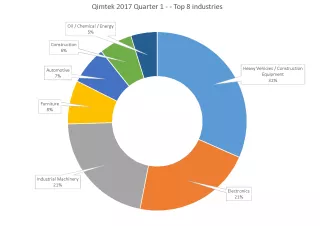
The results from 2017’s first quarter show a reshuffling of the most prominent industries outsourcing manufacturing processes. Whilst the electronics and the industrial machinery sectors remain in second and third place respectively, first place is now occupied by the heavy vehicles industry, which didn’t even feature in 2016’s top three.
Surprisingly, the food & beverage industry - which dominated the forefront of 2016’s results - has slipped entirely out of the latest top eight industries.
Nonetheless, this makes room for the re-emergence of other sectors. Oil & gas, an industry that has famously suffered in the recent past, is now back in the running in eighth place. Outsourcing 5% of all projects from 2017’s first quarter, it is only marginally surpassed by construction (6%) and automotive (7%).
Conclusion
The results from the first quarter of 2017 reflect a buoyant fabrication and machining market, with healthy growth in both areas in comparison to the preceding quarter.
Whilst the fabrication index continues to grow against its 2016 counterpart, machining is still behind despite a massive boost over the previous three months. This is largely due to the fact that the machining index followed a downward trajectory during the course of 2016 and is still in the process of recuperating to earlier levels.
Processes such as casting, toolmaking, finishing, plastics & rubber have tailed off dramatically during the first phase of 2017, having grown by almost 400% from January to December 2016.
The results bear testament to the beginning of the oil & gas industry’s recovery after a period of decline. Whilst the electronics and industrial machinery sectors continue to flourish, food & beverage has slowed in spite of a thriving 2016.