
Karl has been involved in the business to business information service since 1990. Having spent time with information to the construction and manufacturing industry in the UK, Sweden, Switzerland, Germany and the US.

The Contract Manufacturing Index (CMI) has been developed to reflect the total purchasing budget of companies that are looking to outsource manufacturing in any given month.
This reflects a sample of over 4,000 companies, who have a purchasing budget of more than £3bn and a supplier base sample of over 7,000 vendors, with a verified turnover in excess of £25bn.
We measure this by extracting data from the projects we receive from manufacturing purchasers who have an active need for the services of subcontract engineering suppliers.
Since 2016, we have published the index quarterly and the following is a summary of our findings for the first quarter of 2019. In order to shed more light on the emerging trends, we have also broken this down by process and industry.
Key points:
- The Index is split into three processes - Machining, Fabrication, and Others.
- 2019’s data for Quarter 1 is collected from 262 companies and 452 projects.
- Quarter 1’s results are the second-highest in over eighteen months, having risen by 7% in comparison to the last quarter and over 6% in relation to 2018’s first quarter.
- This increase is mainly driven by the fabrication market, which has reached its highest value since the Index began in 2015.
Machining
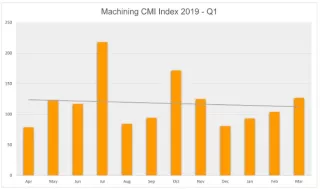
Following a 6% decline in 2018’s fourth quarter, the Machining Index has not yet recovered from the sizeable shrinkage it experienced during December. Therefore, this quarter’s results report a 15% decrease further still; however, it’s worth noting that from month to month, this Index has shown slow but steady recuperation. If the Machining Index follows the same trajectory over the next three months, then we are hopeful that the following quarter’s results will prove much more positive.
- 45% of the first quarter’s projects were for machining processes.
- The buyers who gave us these projects have a total outsourcing value of £21,687,347, compared to a value of £25,257,333 in Quarter 4 2018.
- Quarter 4’s machining index fell by 15% in comparison to the preceding quarter, but has followed an upwards trajectory from month to month, hinting at a gentle recovery.
Fabrication
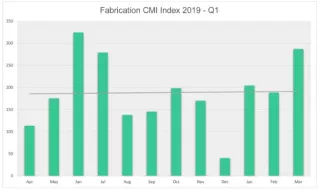
The Fabrication Index has gone from strength to strength during Quarter 1, reporting a phenomenal 66% growth in comparison to the final quarter of 2018. Although the preceding quarter’s results were down 4% on 2018’s third quarter, this could be attributed to seasonal tail-offs in outsourcing. The increase of this particular Index is driving the growth of the Contract Manufacturing Index overall, which is reporting its second-highest results in eighteen months. Meanwhile, the Fabrication Index itself has reached its highest value since its inception in 2015.
- 37% of the first quarter’s projects were for fabrication processes.
- The buyers who gave us these projects have a total outsourcing value of £42,753,347, which is 25% higher than the 2018 average.
- The Fabrication Index grew by a massive 66% in comparison to the preceding quarter and 33% on the comparable quarter for 2018.
- The value of this particular Index has reached its highest level since its inception in 2015.
Others
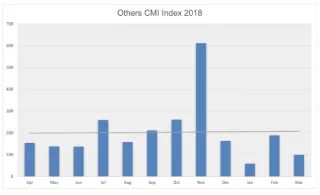
Representing processes such as casting, toolmaking, finishing, plastics & rubber, the ‘Others’ category makes up 18% of the projects from the first quarter and is therefore more difficult to monitor. With the final quarter of 2018 boding extremely well for this particular Index, the same could not be said for Quarter 1, which revealed a dramatic 66% drop alongside a reduction of 42% in relation to the first quarter of 2018.
- 18% of the first quarter’s projects were for processes that fall under the ‘Others’ category.
- The buyers who gave us these projects have a total outsourcing value of £4,491,478 – almost 50% below 2018’s average.
- Despite consistent growth over the latter half of 2018, the Others Index fell by a dramatic 66% in comparison to the preceding quarter.
Industry
- Having previously placed seventh and eighth respectively during Quarter 4, Oil/Chemical/Energy and Medical/Scientific now occupy the top of the first quarter’s results.
- The leaders of Quarter 4 - Electronics, Industrial Machinery and Heavy Vehicles/Construction Equipment - have sunk to the bottom half of the table.
- The Marine industry made its first appearance in over two years, occupying seventh place.
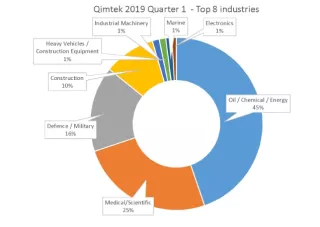
2019’s first quarter has reported an unexpected reshuffling of the top industries represented. Whilst the previous quarter’s results were crowned by Electronics, Industrial Machinery and Heavy Vehicles/Construction Equipment occupying the top three places respectively, this quarter has seen the outsourcing activity of all three drop exponentially. Instead, Quarter 1’s results are dominated by the Oil/Chemical/Energy industry in first place with a massive 45% share of the market, whilst Medical/Scientific and Defence/Military come in second and third place, accounting for 25% and 16% of all subcontract manufacturing over this time period.
It’s interesting to note that Quarter 1 has turned the preceding quarter’s results almost upside-down, as Oil/Chemical/Energy and Medical/Scientific previously placed seventh and eighth, whilst last quarter’s leaders now rank fifth, sixth and eighth overall.
Another notable consideration surrounding the subcontract manufacturing output of the Electronics, Industrial Machinery and Heavy Vehicles/Construction Equipment industries – all of which held only a 1% share of the outsourcing market during Quarter 1 – is that these results may be skewed, or at least made more pronounced by the huge surge in outsourcing demonstrated by the Oil/Chemical/Energy sector.
Elsewhere in the results, the Marine industry has made its first appearance in over two years, although it also only accounted for 1% of the total outsourcing value. The Construction sector also moved from fifth place into fourth, whilst Food & Beverage and Automotive both disappeared from the running entirely.
Summary
Reporting the second-highest results in over eighteen months, Quarter 1’s Contract Manufacturing Index is overwhelmingly positive. Whilst the main driver behind this growth is the Fabrication Index – which rose by a staggering 66% and is now at its highest value since the Index began in 2015 – the Machining Index is showing month-to-month recuperation following a sizeable drop in December.
The Others Index exhibited much more erratic activity, which left it 66% down on the preceding quarter. In spite of a relatively strong performance during February, the deficit of January and March contrasted heavily with this index’s growth during November 2018, resulting in less than positive findings for the quarter overall.
Meanwhile, the Oil/Chemical/Energy sector experienced a sharp surge in subcontract manufacturing activity over this period, placing it top of the industry leader board. The previous quarter’s main outsourcers – Electronics, Industrial Machinery and Heavy Vehicles/Construction Equipment – were unable to match this performance and subsequently fell to the bottom half of Quarter 1’s results.
The latest Contract Manufacturing Index is testament to the fact that the subcontract engineering industry is growing, whilst serving as a positive prelude to what we hope will be a very successful year.