
Karl has been involved in the business to business information service since 1990. Having spent time with information to the construction and manufacturing industry in the UK, Sweden, Switzerland, Germany and the US.

- The Index is split into three processes - Machining, Fabrication, and Others.
- 2020’s data for Quarter 1 is collected from 270 companies and 485 projects.
- For the first time in 12 months, the Contract Manufacturing Index grew during 2020's first quarter.
- The effects of the COVID-19 pandemic have not yet found their way into the data; however, we expect the next quarter's results to be very different.
Quarter 1's Contract Manufacturing Index bears positive results for the UK's manufacturing industry, as it displays growth for the first time in 12 months. Although it is lower than the first quarter of 2019, it is also 69% larger than the previous quarter, putting it 8% up on 2019's overall average. This hints that the UK industry is starting to stabilise following the political upheaval of the last four years.
The main mover is the Machining Index, which displayed rapid growth from January to March 2020. Meanwhile, the Fabrication Index and the Others Index reported results which - although positive - were much more in line with the average for last year.
It is worth bearing in mind that the effects of the COVID-19 pandemic have not yet found their way into the Contract Manufacturing Index's data; however, we expect the next quarter's results to be very different as much of the industry either slows or shuts down completely to weather the storm.
Machining
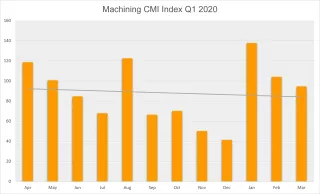
The Machining Index has been the main driver behind the CMI's growth within the first quarter of 2020. Displaying astronomical growth of 89%, this index has finally bucked the trend it set during the whole of 2019, in which it fell incrementally from quarter to quarter. This gives Quarter 1's Machining Index a 27% rise on the average for the whole of 2019.
- 43% of the first quarter’s projects were for machining processes.
- The buyers who gave us these projects have a total outsourcing value of £20,512,633, compared to a value of £10,824,230 in Quarter 4 2019.
- Quarter 4’s Machining Index grew by a massive 89% in comparison to the preceding quarter; this bucks the trend of 2019 in which this index fell incrementally every quarter.
Fabrication
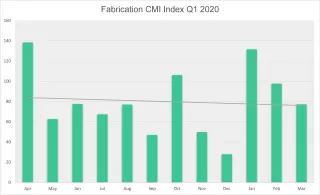
Despite descending into freefall during the last quarter, the first quarter of 2020 saw the Fabrication Index recuperate and grow significantly. This index performed erratically across the whole of 2019; however, the latest results show a massive surge in activity and a much more consistent value from month to month. Although these results are still 4% down on the 2019 average, it's worth bearing in mind that the Fabrication Index started last year at its highest value since the index began, meaning that its current value is still a great result for the UK fabrication industry overall.
- 45% of the first quarter’s projects were for fabrication processes.
- The buyers who gave us these projects have a total outsourcing value of £21,758,807, which is an 87% increase against Quarter 4’s value.
- Despite erratic activity in 2019, the Fabrication Index has recuperated from the freefall it took during the fourth quarter, although it is 4% down against the average for 2019. However, it's important to note that 2019's first quarter put this index at its highest value since the index began, meaning that its current value is still positive overall.
Others
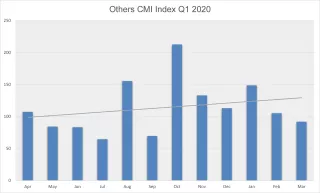
The Others Index was the only index that decreased during Quarter 1 2020, showing a 4% fall against its predecessor. This meant that the index displayed a value which is 10% lower than the 2019 average. However, processes under this category still accounted for 12% of the projects generated within the first quarter, although it declined month to month from January to March.
- 12% of the first quarter’s projects were for processes that fall under the ‘Others’ category.
- The buyers who gave us these projects have a total outsourcing value of £5,734,020, compared to a value of £5,942,295 in 2019's fourth quarter.
- The Others Index was the only index to fall during Quarter 1 2020, putting it at 4% lower than the value of the preceding quarter. This totalled a 10% decrease against the average value of the index across 2019.
Industry
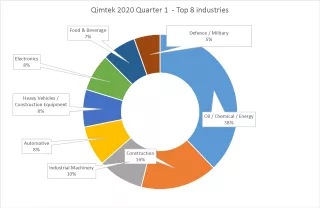
- The Oil/Chemical/Energy sector was the biggest contributor to subcontract spending during Quarter 1, accounting for 38% of the total spend.
- The Construction industry remained in second place for the second consecutive quarter, with a 16% share of the overall spend from January to March.
- Meanwhile, the Industrial Machinery sector accounted for 10% of subcontract purchasing during this period, placing it third for the third consecutive quarter.
The top of Quarter 1's table sees a big change from Quarter 4's results, with the Oil/Chemical/Energy industry in first place and accounting for 38% of the subcontract spending during this period. This is vastly different from the last quarter in which the Heavy Vehicles/Construction Equipment industry led the subcontract purchasing efforts by a considerable landslide, with 68% of the total index. The latter slowed its performance suddenly during Quarter 1 with just an 8% share of the total subcontract spend, seeing it fall into fifth place.
Meanwhile, the Construction industry retained its position in second place (16%) for the second consecutive quarter, having fallen from the top spot during Quarter 4. The Industrial Machinery sector was another non-mover, having remained in third place for the third quarter in a row. This industry accounted for 10% of subcontract purchasing from January to March.
Fourth place also remains unchanged into Quarter 1, showing a consistent performance by the Automotive industry which contributed 8% to the index this quarter. Further down the table, the Electronics sector also had an 8% share of the total spend, which put it in sixth place, whilst the Food & Beverage industry made its first appearance since the fourth quarter of 2018, accounting for 7% of subcontract spending and placing seventh.
Another newcomer to Quarter 1's results was the Defence/Military sector, which was last seen during the first quarter of 2019. This industry placed eighth overall, with a 5% contribution towards the total index.
About the Contract Manufacturing Index
The Contract Manufacturing Index (CMI) has been developed to reflect the total purchasing budget of companies that are looking to outsource manufacturing in any given month.
This reflects a sample of over 4,000 companies, who have a purchasing budget of more than £3bn and a supplier base sample of over 7,000 vendors, with a verified turnover in excess of £25bn.
We measure this by extracting data from the projects we receive from manufacturing purchasers who have an active need for the services of subcontract engineering suppliers.
Since 2016, we have published the index quarterly and this report is a summary of our findings for the first quarter of 2020. In order to shed more light on the emerging trends, we have also broken this down by process and industry.