
Karl has been involved in the business to business information service since 1990. Having spent time with information to the construction and manufacturing industry in the UK, Sweden, Switzerland, Germany and the US.

The Contract Manufacturing Index (CMI) has been developed to reflect the total purchasing budget of companies that are looking to outsource manufacturing in any given month.
This reflects a sample of over 4,000 companies, who have a purchasing budget of more than £3bn and a supplier base sample of over 7,000 vendors, with a verified turnover in excess of £25bn.
We measure this by extracting data from the projects we receive from manufacturing purchasers, who have an active need for the services of subcontract engineering suppliers.
Since 2016, we have published the index quarterly and the following is a summary of our findings for the second quarter of 2017. In order to shed more light on the emerging trends, we have also broken this down by process and industry.
Key points
- The Index is split by three processes - Machining, Fabrication and Others.
- 2017’s data for quarter 2 is collected from 298 companies and 467 projects.
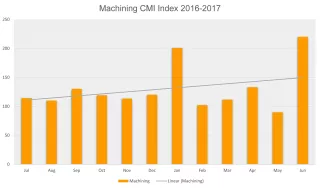
Machining
Compared to the previous quarter, machining enjoyed a 7.5% increase in quarter 2, although this is still down 12% in comparison to the same quarter in 2016. Our 2016 annual summary revealed that the size of companies outsourcing machining - and subsequently, its index - fell dramatically over the course of last year. The latest results reinforce a slow-but-steady recovery for 2017’s machining market, as it starts to claw back what it lost in the previous year.
Key Points
- 56% of the second quarter’s projects were for machining processes.
- The buyers who gave us these projects have a total outsourcing value of £22,893,953, which is above the average for 2017 and 2016.
- The machining index grew by 7.25% compared to last quarter; which is up 6% on the average over the whole of 2016.
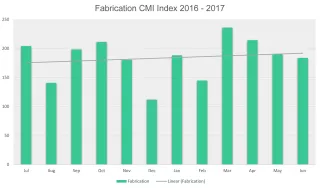
Fabrication
The first quarter’s fabrication index uncovered a 12% growth on its predecessor, as well as an impressive 8% rise in comparison to 2016’s average. The results for the second quarter reaffirm its continuing expansion - although slower - with a further 3.1% growth reflected in the index. Whereas machining experienced massive fluctuations last year, the fabrication index’s trajectory underwent a steady rise, albeit with large variations from month to month.
Key Points
- 36% of the second quarter’s projects were for fabrication processes.
- The buyers who gave us these projects have a total outsourcing value of £20,613,033, which is an 11% increase on the average for the whole of 2016.
- The fabrication index grew by 3.1% compared to last quarter.
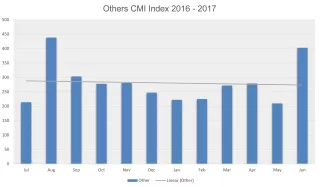
Others
Representing processes such as casting, toolmaking, finishing, plastics & rubber, the ‘Others’ category only makes up 8% of the projects from the second quarter and is therefore more difficult to monitor. However, the results show that the index for this category has increased by 24% on the last quarter and is at the same level as the 2016 average.
Key Points
- Only 8% of the second quarter’s projects were for processes that fall under the ‘Others’ category.
- The buyers who gave us these projects have a total outsourcing value of £4,460,033, which is the same level as 2016’s average
- The index for these processes grew by 24% compared to last quarter.
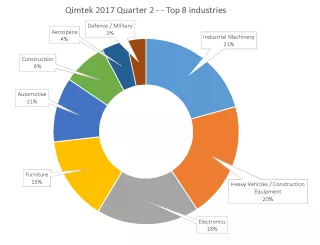
Industry
Industrial Machinery features in first place, outsourcing over 21% of quarter 2’s projects. This has risen from third place in quarter 1.
Heavy Vehicles / Construction Equipment is the second largest contender, representing 20% of projects from 2017’s second quarter.
Electronics comes in third place for quarter 2, having previously occupied second place in quarter 1. 18% of projects are represented by this sector.
Although industrial machinery now occupies the top spot as the sector outsourcing the most manufacturing, it is important to note that the percentage of projects has not changed within this industry, remaining at 21% for both quarter 1 and quarter 2. This indicates a decrease in subcontract engineering amongst other industries, as opposed to a sudden surge of outsourcing within the industrial machinery sector itself. Indeed, the top three industries remained the same for both the first and second quarter despite a reshuffle, which occurred due to a drop in the percentage of projects outsourced by both the electronics and heavy vehicle / construction equipment industries.
Having (maybe somewhat surprisingly) featured in eighth place within the first quarter’s results, the oil & gas industry has once again disappeared from the running. Both the aerospace and defence sectors have emerged in quarter 2’s results, coming in seventh and eighth, respectively.
Occupying the middle of the table are the furniture, automotive and construction industries, which have stayed put throughout the whole of 2017’s first and second quarters.
Conclusion
The results for April, May and June are somewhat erratic; however, they show an upwards trajectory for all three categories.
Having undergone a steady rise during 2016, the fabrication market has not bucked this trend. Although the second quarter’s growth is smaller in comparison to the preceding quarter, it continues to thrive alongside machining, which is in the process of recovering from a dramatic decline over the course of last year.
Processes such as casting, toolmaking, finishing, plastics & rubber have also flourished during quarter 2, having shrunk dramatically during the first three months of 2017.
The second quarter’s findings - along with those of various other surveys and reports from the industry - are tangible proof of the sentiments of our members; the manufacturing sector is undergoing a period of growth and expansion, with many companies experiencing a steady influx of work.