
Karl has been involved in the business to business information service since 1990. Having spent time with information to the construction and manufacturing industry in the UK, Sweden, Switzerland, Germany and the US.

- The Index is split into three processes - Machining, Fabrication, and Others.
- 2019’s data for Quarter 2 is collected from 247 companies and 432 projects.
- Quarter 2’s Index has fallen to just 101, which is the lowest since the Index was first published in Quarter 1 of 2015.
- This slump is largely due to a decline in outsourcing among larger companies, particularly those based within the West Midlands - the heart of the automotive industry.
Overall, the Index for 2019’s second quarter has not enjoyed the same positivity as its predecessor. The indication is that the subcontract manufacturing industry has entered a period of reduced output - an observation mirrored by the Manufacturing PMI, as well as the Office of National Statistics (ONS) manufacturing figures. The Index is now at its lowest since its inception in Quarter 1 of 2015, sitting at just 101 in contrast to a strong first quarter.
This tail-off can be attributed to any number of reasons, but the most prominent is a reduction in outsourcing amongst larger-spending companies. Far from being exclusive to one or two industries, these cutbacks are seen across every sector excluding Construction; however, it’s important to note that similar indexes have reported that Construction is also reeling in its subcontract manufacturing efforts.
Perhaps the most affected region is the West Midlands, which is home to the UK’s automotive industry. In the wake of an uncertain political climate, automotive OEMs have famously sought to reassess their manufacturing strategies going forward, with the resulting downturn now tangibly evident.
Although the fluctuation in performance from Quarter 1 to Quarter 2 leaves us uncertain as to what the rest of the year will hold, we remain positive that our national industry will improve - or at least stabilise - in line with clarification of the UK’s political future.
Machining
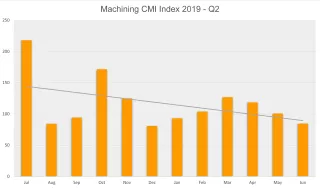
The machining index experienced a rocky start to 2019, falling by 15% in addition to a 5% decrease during the fourth quarter of 2018. Unfortunately the latest Index has not bucked this emerging trend, falling by 14% further still. The total outsourcing value of active machining buyers during this quarter totalled £18,653,248, compared to £21,877,603 reported in the comparable quarter of 2018. The latest results confirm that this Index is undergoing a difficult period, with a decrease in the purchasing of subcontract machining services.
- 39% of the second quarter’s projects were for machining processes.
- The buyers who gave us these projects have a total outsourcing value of £18,653,248, compared to a value of £21,687,347 in Quarter 1 2019.
- Quarter 2’s machining index fell by 14% in comparison to the preceding quarter.
Fabrication
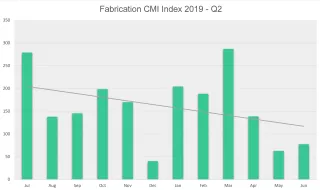
Despite reaching its highest value in Quarter 1 since the Index began, Quarter 2’s fabrication index revealed an almost complete reversal of the 66% rise it had previously undergone. Declining by 60% from April to June, the fabrication sector failed to gain traction during Quarter 2; however, it still accounted for a larger share of the market than that of its machining counterpart. This performance is largely attributed to an extremely slow May, whilst June failed to grant the fabrication market the boost it needed.
- 48% of the second quarter’s projects were for fabrication processes.
- The buyers who gave us these projects have a total outsourcing value of £17,299,955, which is 60% lower than that of the preceding quarter.
- The latest results are a substantial setback for the buoyancy of this particular Index, which reached its highest value in Quarter 1 since the Index began in 2015.
Other
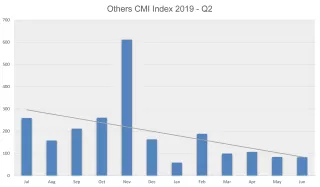
Representing processes such as casting, toolmaking, finishing, plastics & rubber, the ‘Others’ category makes up 13% of the projects generated within the second quarter and is therefore more difficult to monitor. However, this index was the only one to follow a positive trajectory during Quarter 2, experiencing growth of 66% in contrast to the 66% drop seen during Quarter 1. Therefore, the Others index has gone into the third quarter of 2019 with the same market share it held at the start of the year.
- 13% of the second quarter’s projects were for processes that fall under the ‘Others’ category.
- The buyers who gave us these projects have a total outsourcing value of £7,450,603.
- After falling 66% during Quarter 1, this index clawed back the same amount of ground during Quarter 2, making it the only index to follow a positive trajectory.
Industry
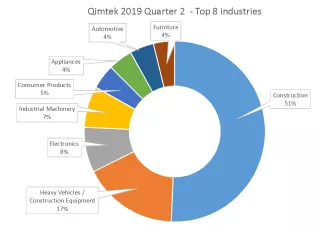
- The construction sector dominated Quarter 2’s results, accounting for 51% of outsourcing during this period.
- Having previously featured fifth in the last quarter’s results, Heavy Vehicles/Construction Equipment now places second, but only accounts for 17% of outsourcing in contrast to Construction’s performance.
- Electronics was the third largest-spending sector during Quarter 2, after barely scraping into Quarter 1’s top eight industries.
Having placed fifth and fourth respectively during the two preceding quarters, the Construction industry has somewhat surprisingly dominated Quarter 2’s purchasing efforts. Accounting for a phenomenal 51% of the market, this industry has gone from strength to strength, surpassing the performance of all other sectors by a huge margin. The closest runner-up, with just a 17% share by contrast, was the Heavy Vehicles/Construction Equipment sector, having featured fifth in the last quarter’s results. In third was the Electronics industry, which ascended from eighth place in Quarter 1. This industry has displayed an erratic performance over the previous six months, with the last quarter of 2018 seeing it place first.
The Industrial Machinery sector also increased its output last quarter, following a strong end to 2018 and a weaker presence from January to March. With a 7% share of total outsourcing efforts, this industry placed squarely in the middle of the leaderboard, although not by a substantial deficit.
The bottom half of Quarter 2’s table exclusively houses sectors which were not present in the preceding quarter. Consumer Products, Appliances, Automotive and Furniture all demonstrated a stronger performance from April to June, with Consumer Products holding a 5% share and the remainder each accounting for 4% respectively. Needless to say, this means that a number of sectors have dropped out of the running entirely from Quarter 1, including lesser-performing industries such as Marine and Electronics, alongside those that had exhibited a vigorous output such as Medical/Scientific and Defence/Military.
About the Contract Manufacturing Index
The Contract Manufacturing Index (CMI) has been developed to reflect the total purchasing budget of companies that are looking to outsource manufacturing in any given month.
This reflects a sample of over 4,000 companies, who have a purchasing budget of more than £3bn and a supplier base sample of over 7,000 vendors, with a verified turnover in excess of £25bn.
We measure this by extracting data from the projects we receive from manufacturing purchasers who have an active need for the services of subcontract engineering suppliers.