
Karl has been involved in the business to business information service since 1990. Having spent time with information to the construction and manufacturing industry in the UK, Sweden, Switzerland, Germany and the US.

- The Index is split into three processes - Machining, Fabrication, and Others.
- 2025’s data for Quarter 2is collected from 183 companies and 285 projects.
- Quarter 2's Index increased with 62% against the previous quarter
The manufacturing landscape in Quarter 2 of 2025 presented a mixed picture, with the Contract Manufacturing Index (CMI) showing strong growth while the S&P Global UK Manufacturing PMI indicated an ongoing downturn, albeit with some signs of stabilisation towards the end of the quarter. Economic factors such as inflation, wage growth, and uncertainty continued to influence businesses throughout the period.
Machining
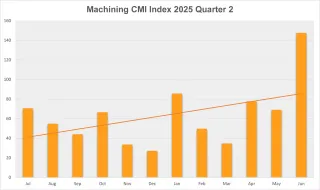
- 57% of second quarter projects were from machining processes.
- The buyers of machining processes have a total outsourcing value of £19,694,910
- The index for machining is up 73% from previous quarter and up 43% on previous year
Fabrication
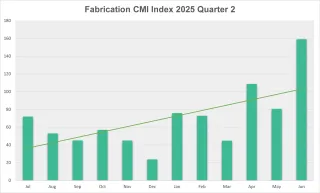
- 36% of second quarter projects were from fabrication process
- The buyers of fabrication processes has a total outsourcing value of £21,907,989
- The index for Fabrication is up 80% on last quarter and 127% up on last year's figures.
Others
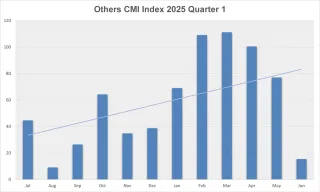
- 8% of second quarter projects were from other processes
- The buyers of other processes has a total outsourcing value of £2,498,483
- The index for Others is up down 34% on last quarter and pretty much the same as last year's quarter 2
Lead Times
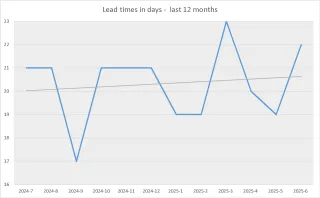
The lead times dropped in April and May to 19 days but then jumped up to 22 days in June. However, quoting reduced during the 2nd quarter and is continuing to drop in July.
Industry
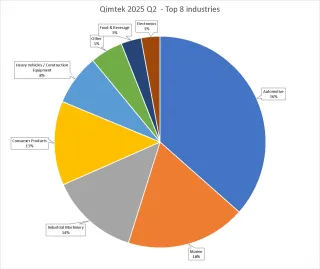
Unusually, automotive is the largest sector but that is mainly due to some very large tier 1 manufacturers being included in the index this quarter. Otherwise, Industrial Machinery dropped from its usual 1st place down to third and Marine is up to third.
About Contract Manufacturing Index
The Contract Manufacturing Index (CMI) has been developed to reflect the total purchasing budget of companies that are looking to outsource subcontract manufacturing of custom made parts in any given month.
This reflects a sample of over 4,000 companies, who have a purchasing budget of more than £5bn and a supplier base sample of over 7,000 vendors, with a verified turnover in excess of £25bn.
We measure this by extracting data from the projects we receive from manufacturing purchasers who have an active need for the services of subcontract engineering suppliers.
Since 2016, we have published the index quarterly and this report is a summary of our findings for the this current quarter. In order to shed more light on the emerging trends, we have also broken this down by process and industry.