
Karl has been involved in the business to business information service since 1990. Having spent time with information to the construction and manufacturing industry in the UK, Sweden, Switzerland, Germany and the US.

The Contract Manufacturing Index (CMI) has been developed to reflect the total purchasing budget of companies that are looking to outsource manufacturing in any given month.
This reflects a sample of over 4,000 companies, who have a purchasing budget of more than £3bn and a supplier base sample of over 7,000 vendors, with a verified turnover in excess of £25bn.
We measure this by extracting data from the projects we receive from manufacturing purchasers, who have an active need for the services of subcontract engineering suppliers.
Since 2016, we have published the index quarterly and the following is a summary of our findings for the fourth quarter of 2017. In order to shed more light on the emerging trends, we have also broken this down by process and industry.
Key points:
- The Index is split into three processes - Machining, Fabrication, and Others.
- 2017’s data for quarter 4 is collected from 309 companies and 508 projects.
- Quarter four results are down 20% on 2017’s average.
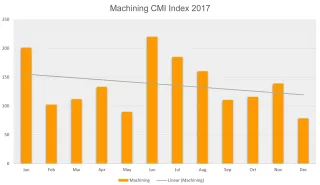
Machining
After undergoing a 3% rise during the third quarter of 2017, quarter four proved much less successful than its predecessor. During the final three months of the year, the machining index fell by a massive 27% - a decrease of 19% on the year’s average. This is in addition to a sharp downturn over the course of 2016 - a setback from which the machining index had previously been recovering.
- 54% of the fourth quarter’s projects were for machining processes.
- The buyers who gave us these projects have a total outsourcing value of £17,210,702, which is below average for 2017.
- Quarter four’s machining index fell by 27% in comparison to the preceding quarter - a decrease of 19% in relation to 2017’s average.
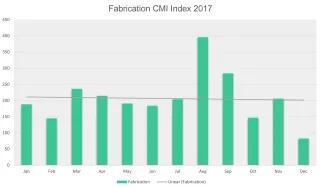
Fabrication
Quarter four reversed the uplift that the preceding quarter brought to the fabrication index, bringing with it a 50% decrease, in contrast to the 50% rise it has previously experienced. Despite the latest results being 29% down on the average for 2017, the fabrication market still accounted for 39% of the total projects generated.
- 39% of the fourth quarter’s projects were for fabrication processes.
- The buyers who gave us these projects have a total outsourcing value of £15,238,613.
- The fabrication index fell by 50% in comparison to quarter three, with the latest results down 29% on the year’s average.
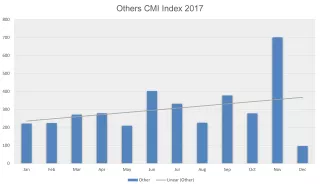
Others
Representing processes such as casting, toolmaking, finishing, plastics & rubber, the ‘Others’ category only makes up 7% of the projects from the fourth quarter and is therefore more difficult to monitor. However, the results show that the index for this category has increased by 15% on the last quarter and by 19% in relation to the year’s average.
- Only 7% of the fourth quarter’s projects were for processes that fall under the ‘Others’ category.
- The buyers who gave us these projects have a total outsourcing value of £5,388,710, which is up by a sizeable 19% on the average over the whole of 2017.
- The index for these processes grew by 15% compared to the third quarter.
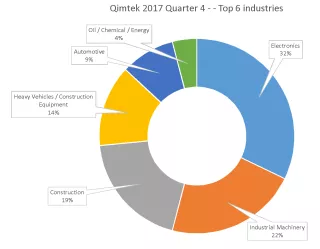
Industry
- For the second quarter in a row, electronics features in first place, representing 32% of the market.
- The second largest contender is the industrial machinery sector, with a 22% standing in quarter four.
- The construction industry outsourced 19% of the total projects generated within the fourth quarter, placing it in third position.
The top two industries are unchanged from quarter three into quarter four, with both the electronics and the industrial machinery sectors remaining static in their respective positions. This is in spite of a 2-3% decrease across both sectors over the last three months. The construction industry performed extremely well, having grown from 10% in quarter three, to 19% in quarter four - a total increase of 90%. This surge resulted in construction climbing from fifth place into third, knocking the heavy vehicles/construction equipment sector down into fourth.
Having disappeared from the top industries since quarter 1, oil/chemical/energy re-emerged into the results for the fourth quarter, representing 4% of the total projects generated. However, it’s important to note that its rise into sixth place is not due to an increase within the sector itself, but rather a result of the furniture and consumer products industries falling dramatically between October and December. This mirrors the downwards trajectory of the consumer products industry as recorded in both the ONS report and the CIPS Manufacturing Index.
Conclusion
The fourth quarter saw a slowing of both the machining and the fabrication markets - both of which had reported consistent growth over the preceding nine months. The index first showed signs of slowing within September, which set the general trend for the final quarter of 2017. However, both the Qimtek Contract Manufacturing Index and the CIPS Manufacturing Index showed a sustained upwards curve within the final weeks of the year, meaning that recovery within the first quarter of 2018 is entirely possible.
Nonetheless, processes such as casting, toolmaking, finishing, plastics & rubber rose by a substantial 15% from October to December and reported a massive 19% increase on the average over the whole of 2017. Having declined by 12% in quarter one, this area of the index recuperated well over the remainder of the year, with the latest results setting the groundwork for continued growth.