
Karl has been involved in the business to business information service since 1990. Having spent time with information to the construction and manufacturing industry in the UK, Sweden, Switzerland, Germany and the US.

- The Index is split into three processes - Machining, Fabrication, and Others.
- 2020’s data for Quarter 4 is collected from 215 companies and 325 projects.
- Quarter 4's Contract Manufacturing Index has a total value of £28,785,014, compared to £54,581,000 in the previous quarter.
- Although Quarter 4's Index was 45% down on the previous quarter, this is in keeping with historical data which typically shows a marked downturn in activity during Quarter 4.
- November was the busiest month within Quarter 4, as shown in the graph above.
Quarter 4's Contract Manufacturing Index showed a significant reduction in activity compared to its predecessor. Whilst Quarter 3's Index reported substantial growth after the first national lockdown of Quarter 2, the latest results have seen the Index shrink to a total value of £28,785,014, compared to £54,581,000 in the previous quarter. With another national lockdown presiding over most of November, it would be an easy assumption that this was to blame for the slowdown in activity; however, it's worth noting that November was actually the most active month overall during this period.
Historical data has typically seen the Index undergo a seasonal drop during Quarter 4, which may be largely responsible for the latest results. In fact, the latest Index mirrors that of the comparable quarter for 2019, showing 1% growth against these figures. The political climate may also be a contributing factor to the decline in activity; with EU trade uncertainty continuing to plague many businesses, an air of uncertainty has been commonplace since the referendum results were announced in 2016.
Other indexes have reported contrasting results, however. The CIPS Purchasing Manager's Index actually saw growth during the final three months of the year, which indicates that the national appetite is focused on existing orders, as well as a certain amount of stockpiling in an uncertain climate. New projects may have been put on the backburner while the dust settles and the industry absorbs the implications of recent events - political and otherwise.
Although the industry is braced for the effects of a third national lockdown in the first quarter of 2021, we are hopeful that the growing clarity towards EU trade will allow the UK manufacturing industry to gain some confidence in the near future.
Machining Index
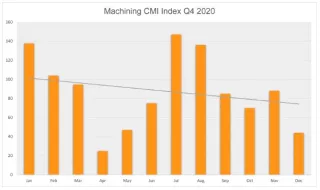
The Machining Index fell by 6% from Quarter 3 into Quarter 4; however, it performed relatively well when seasonal trends are taken into consideration. In comparison to the fourth quarter of 2019, this Index grew by 37%; despite the challenges of 2020, the machining market appeared to finish the year on something of a high. This marked a positive end to a turbulent period for the Machining Index, which has recuperated well since the national lockdown in Quarter 2.
- 56% of the fourth quarter’s projects were for machining processes.
- The buyers who gave us these projects have a total outsourcing value of £14,855,550, compared to a value of £16,245,736 in Quarter 3 2020.
- Although this Index shrank by 6% in comparison to the preceding quarter, it grew by a massive 37% against the comparable quarter for 2019.
Fabrication Index
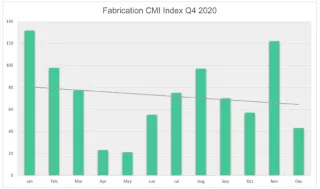
Despite a strong third quarter, the Fabrication Index did not perform as strongly from October to December, resulting in a 70% decline over this period. This Index had previously shown remarkable growth since the events of the second quarter, with Quarter 3 marking a peak in activity since the first quarter of 2019. However, its output dropped dramatically during Quarter 4 - even in relation to the fourth quarter of 2019, which had an additional 23% on the latest results.
- 31% of the fourth quarter’s projects were for fabrication processes.
- The buyers who gave us these projects have a total outsourcing value of £8,915,075, compared to £30,265,347 during Quarter 3.
- The Fabrication Index did not fare well from October to November 2020 and shrank by 70% from Quarter 3 to Quarter 4. In addition, this Index fell 23% in comparison to the fourth quarter of 2019.
Others Index
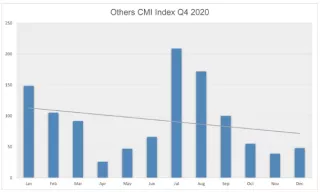
Representing processes such as casting, toolmaking, finishing, plastics & rubber, the ‘Others’ category makes up 12% of the projects generated within the fourth quarter and is therefore more difficult to monitor. However, the Others Index decreased its output during Quarter 4 and fell by 17%, following its strongest performance since the second quarter of 2019 in the preceding quarter. This result also proved to be substantially lower than the comparative quarter of 2019, showing a decrease of 16%.
- 12% of the fourth quarter’s projects were for processes that fall under the ‘Others’ category.
- The buyers who gave us these projects have a total outsourcing value of £5,014,370, compared to a value of £6,069,870 in Quarter 3, 2020.
- The final three months of 2020 saw this Index fall by 17%; in addition, there was a decrease of 16% in relation to Quarter 4 2019.
Top Industries
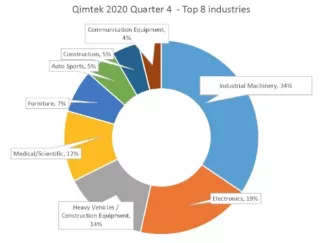
- The biggest contributor towards subcontract purchasing during Quarter 4 2020 was the Industrial Machinery sector, which accounted for 34% of the total spend during this period.
- The Electronics sector also underwent a sharp rise in activity, climbing from sixth to second place during Quarter 4.
- The Heavy Vehicles/Construction Equipment sector dramatically increased outsourcing efforts from October to December, contributing 14% of the total spend. This saw the industry in question rise from ninth place into third.
Having placed second during Quarter 3, the Industrial Machinery sector significantly increased its spend on subcontract engineering services from October to December, putting it at the top of the leaderboard for Quarter 4. This industry accounted for 34% of the total spend during this period, comparative to just 16% during Quarter 3. The Electronics sector also saw a sharp rise in activity and accounted for 19% of the overall spend, resulting in a climb from sixth place into second place in Quarter 4.
However, the most dramatic ascension came from the Heavy Vehicles/Construction Equipment industry, which finished the year in third place and contributed 14% of the total spend from October to December. This sector failed to appear in the top industry results altogether during Quarter 3, instead placing ninth, showing a remarkable surge in subcontract purchasing during the final three months of the year.
Elsewhere, the Medical/Scientific sector, as well as the Furniture industry, both performed consistently from Quarter 3 into Quarter 4. These industries placed fourth and fifth, moving from seventh and fourth in Quarter 3 respectively. The Autosports industry is a newcomer to Quarter 4's results, making its premier appearance for 2020 and finishing in sixth place. Accounting for 5% of subcontract purchasing during this period, this is the first time that the Autosports industry has placed in a number of years, perhaps indicating that this sector is undergoing something of a resurgence.
As the forerunner of Quarter 3's results, the Construction industry slowed down its activity substantially during Quarter 4 and finished in seventh place. In order to provide some context as to the extent of its decline, this sector accounted for 34% of the total spend during Quarter 3, compared to just 5% of Quarter 4's spend, which is ultimately much smaller in line with the seasonal shrinkage of the Index overall. Lastly, the Communication Equipment sector proved to be another newcomer to the results, contributing 4% of Quarter 4's subcontract spend and finishing in eighth place.
As a result of the industry shake-up seen during Quarter 4, a number of sectors dropped out of the running altogether in the latest results, including Marine (previously third), Food & Beverage (previously fifth) and Oil/Chemical/Energy (previously eighth).
About the Contract Manufacturing Index
The Contract Manufacturing Index (CMI) has been developed to reflect the total purchasing budget of companies that are looking to outsource manufacturing in any given month.
This reflects a sample of over 4,000 companies, who have a purchasing budget of more than £3bn and a supplier base sample of over 7,000 vendors, with a verified turnover in excess of £25bn.
We measure this by extracting data from the projects we receive from manufacturing purchasers who have an active need for the services of subcontract engineering suppliers.
Since 2016, we have published the index quarterly and this report is a summary of our findings for the fourth quarter of 2020. In order to shed more light on the emerging trends, we have also broken this down by process and industry.